Law of supply
The law of supply is the microeconomic law that states that all other factors being equal, as the price of a good or service increases, the number of goods or services that suppliers offer will increase, and vice versa. The law of supply says that as the price of an item goes up, suppliers will attempt to maximize their profits by increasing the quantity offered for sale.
Assumptions of Law of Supply:
(i) Nature of Goods. If the goods are perishable in nature and the seller cannot wait for the rise in price. Seller may have to offer all of his goods at the current market price because he may not take risk of getting his commodity perished.
(ii) Government Policies. The government may enforce the firms and producers to offer products at the prevailing market price. In such a situation producer may not be able to wait for the rise in price.
(iii) Alternative Products. If a number of alternative products are available in the market and customers to tend to buy those products to fulfill their needs, the producer will have to shift to transform his resources to the production of those products.
(iv) Squeeze in Profit. Production costs like raw materials, labor costs, overhead costs, and selling and administration may increase along with the increase in price. Such situations may not allow the producer to offer his products at a particular increased price.
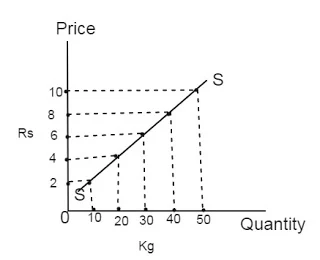
The concept of law of supply can be explained with the help of a supply schedule and a supply curve:
Price per kg | Quantity supplied |
Rs. 10 | 50 kg |
Rs. 8 | 40 kg |
Rs. 6 | 30 kg |
Rs. 4 | 20 kg |
Rs. 2 | 10 kg |
In the above schedule, we can observe that when the price was Rs 10 per kg, quantity supplied was 50 kg. When the price declined to Rs 8 and Rs 6, the quantity supplied also decreased to 40 kg and 30 kg respectively and so on. This shows that, as price decreases, quantity supplied decreases and vice versa. We can present the above schedule in a graph as follows:


0 Comments
If this article has helped you, please leave a comment.