Price Line (Budget Line)
The budget line shows all those combinations of two goods, which a consumer can purchase by spending his given money income. A consumer can purchase any combination of two goods that lies on the budget line with his given money income and given market prices of goods.We know that a higher indifference curve shows a higher level of satisfaction than a lower one. Therefore, a rational consumer tries to reach the highest possible indifference curve to get the highest possible level of satisfaction. But the consumer has limited income which acts like a constraint or limitation to his utility-maximizing behavior. This is known as a budget constraint. The budget constraint may be expressed as:
Px. Qx + Py. Qy = M .......(i)
Where,
Px = price of X
Py = price of Y
Qx = quantity of X commodity
Qy = quantity of Y commodity
M = money income
The price line or Budget line is based on the following assumptions:
Px = price of X
Py = price of Y
Qx = quantity of X commodity
Qy = quantity of Y commodity
M = money income
The price line or Budget line is based on the following assumptions:
- The consumer has to pay for the goods, and
- A consumer has a limited income.
Suppose, a consumer has Rs. 100 to spend on goods X and Y. Price of X is Rs. 20 per unit and the price of Y is Rs. 10 per unit. If the consumer spends all his money income on the purchase of good X, he would buy 5 units of X. If he spends all his income on the purchase of Y goods, he would buy 10 units of Y. If we join these two combinations, we will get a line which is called budget line or price line.
The combinations of goods lying to the right of the budget line are unattainable because the income of the consumer is not sufficient to purchase those combinations. The combinations lying to the left of the budget line are attainable but not desirable.
The intercept OB on the Y-axis equals the amount of this entire income divided by the prices of commodity Y, i.e, OB = M/Py. Likewise, the intercept OL on the X-axis measures the total income divided by the price of commodity X. Thus OL = M/Px. ‘
If the consumer spends all his income on Y commodity, then Qy = M/Py (since X = 0). Similarly, if he spends his whole income on X commodity, then Qx= M/Px (since, Y = 0). M/Py shows the amount of commodity-Y that can be purchased if the quantity of Y is zero. M /Px shows the amount of commodity-X that can be purchased if the quantity of Y is zero.
The slope of the Price Line (Budget Line)
In order to obtain the slope of the budget line, we rewrite equation ...(i) asQy = (M/Py) - (Px/Py)Qx ......(ii)
Differentiating equation (ii) with respect to X partially, we get the slope of the budget line as;
( δQy/ δQx ) = -(Px/Py)
Since prices are always positive, the slope of the budget line is negative. The negative slope of the budget line indicates that if the consumer wants to spend more on one commodity he must decrease the money expenditure for another commodity because of the budget constraint.
Swing in Price Line (Budget Line)
Ceteris Paribus, when the price of the particular commodity changes, the budget line will swing upward or downward. If the price of the commodity decreases, the purchasing power of the consumer increases, which causes an upward swing in the price line. Similarly, when price increases, the purchasing capacity of a consumer decreases, which causes a downward swing in the price line. It can be clarified with the help of the following figure:Here, the total budget of the consumer is Rs. 50 where the price of the 'X' commodity is Re. 10 and the price of the 'Y’ commodity is Rs. 5. In the above figure, LM is the initial budget line where the consumer allocates his total budget of Rs. 50 into X and Y commodity consuming 3 units of X commodity (Rs. 30) and 4 units of Y commodity (Rs. 20). Suppose the price of 'X' commodity decreases from Rs. 10 to Rs. 6, the consumer can increase the consumption of X commodity from 3 units to 6 units without reducing Y commodity which causes an upward swing in the budget line that is ‘LN’.
Similarly, if the price of X commodity increase from Rs.10 to Rs.15, consumers can only consume 2 units of X commodity and 6 units of Y commodity which causes a downward swing in the budget line (i.e, LP)
Similarly, if the price of X commodity increase from Rs.10 to Rs.15, consumers can only consume 2 units of X commodity and 6 units of Y commodity which causes a downward swing in the budget line (i.e, LP)
The shift in Price Line (Budget Line)
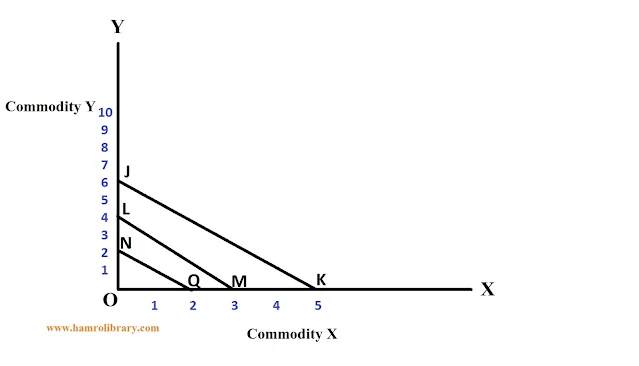
Other things remaining the same, when the income of consumers changes, there is a shift in the budget line or price line. When income increases, the budget line shifts rightward, where consumers can consume more units of both X and Y commodities. On the other hand, if income decreases, the consumption level decreases, which causes a leftward shift in the price line. It can be shown as follows:Similarly when a consumer's income decreases to Rs.40 then the price line shifts downward to NQ where the consumer only can consume 2 units of X commodity (Rs. 20) and 2 units of Y commodity (Rs. 30). In this way, the change in consumer income shifts the budget line upward or downward when the price is a constant.


.jpeg)
0 Comments
If this article has helped you, please leave a comment.